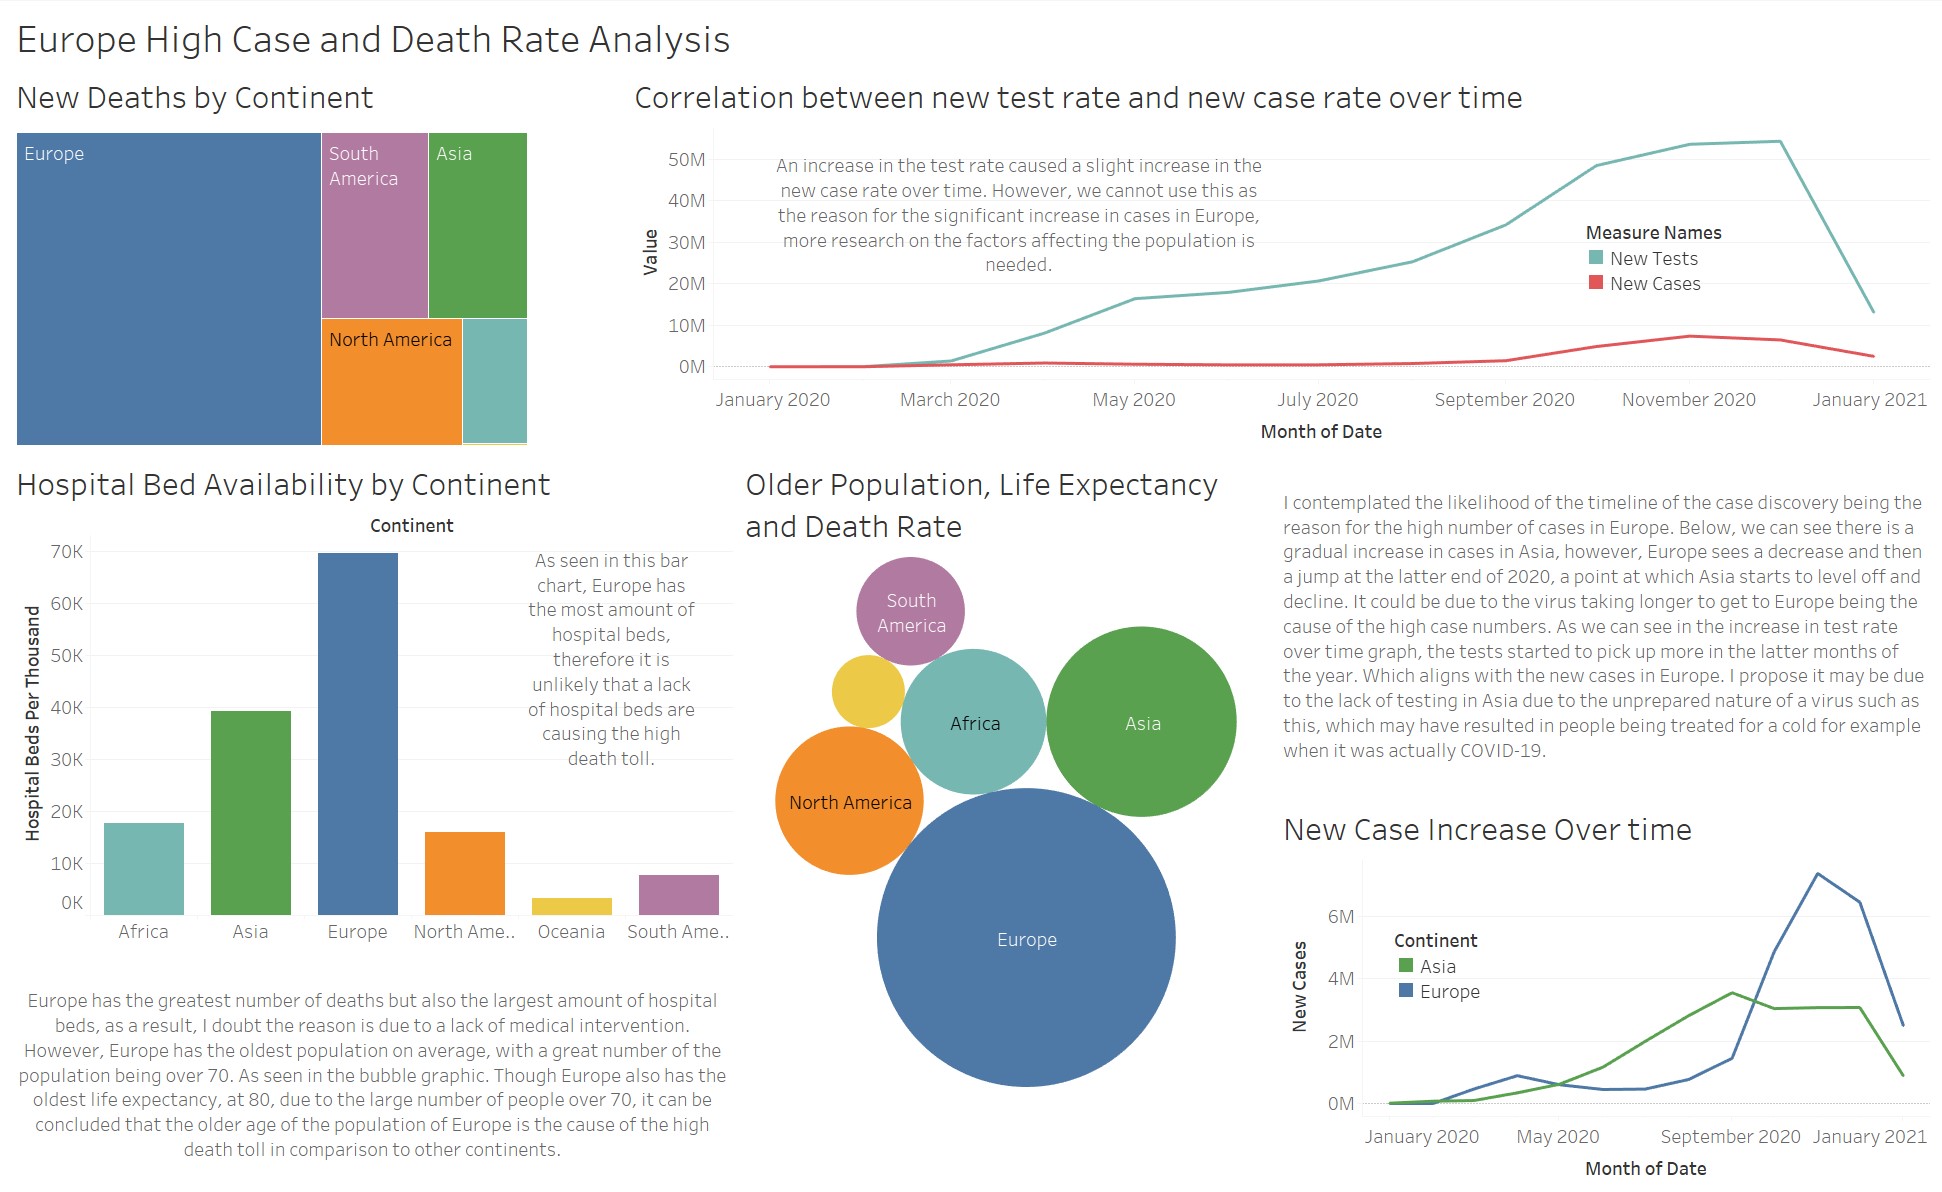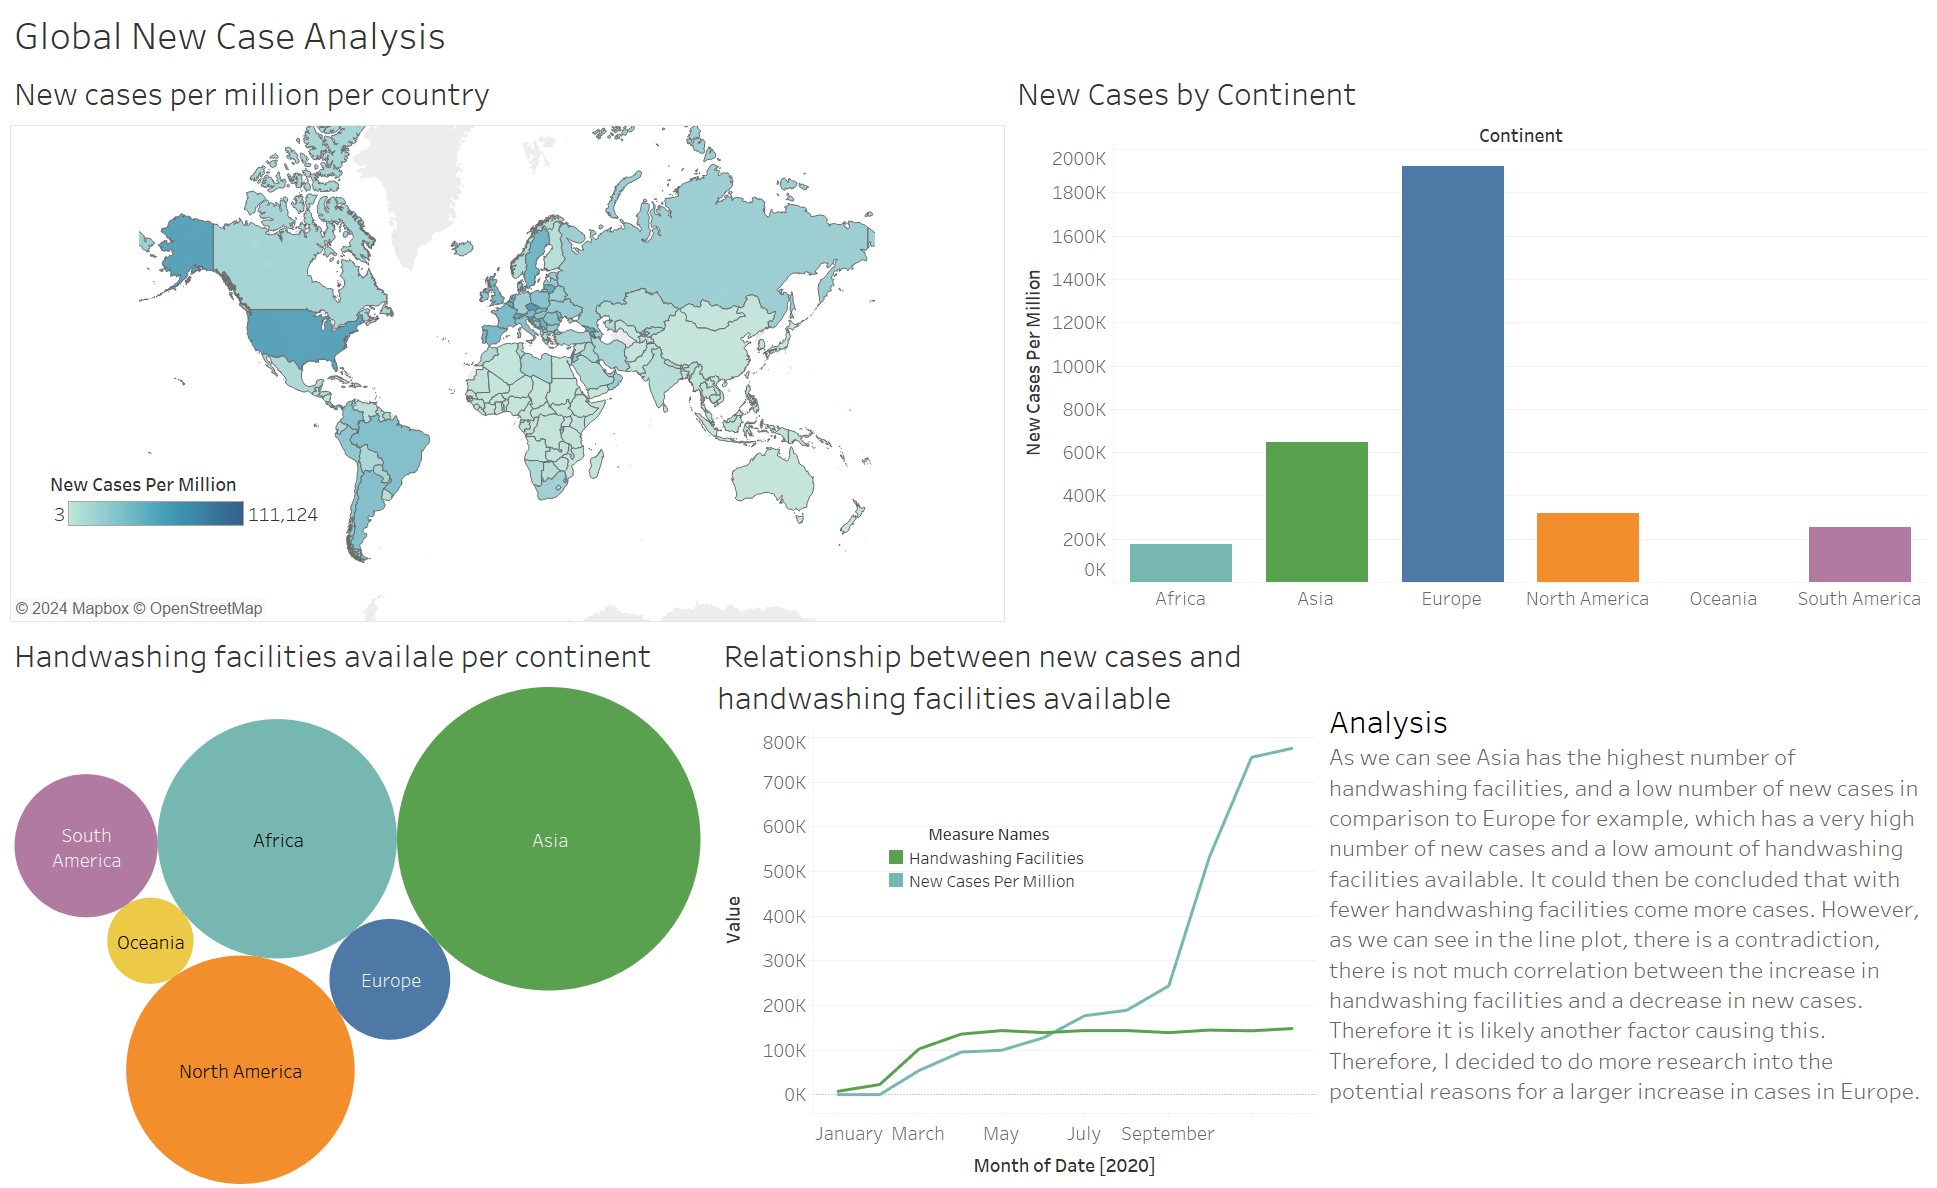
Global COVID-19 Measures Analysis Visualisation in Tableau
For this project, I used various tools available in Tableau. Including interactive map graphics, line plots, heat maps, among other visualizations. I split my analysis first to compare data Globally and then in Europe. I analysed the test, death and vaccination rates to display the differences in the continents and countries.